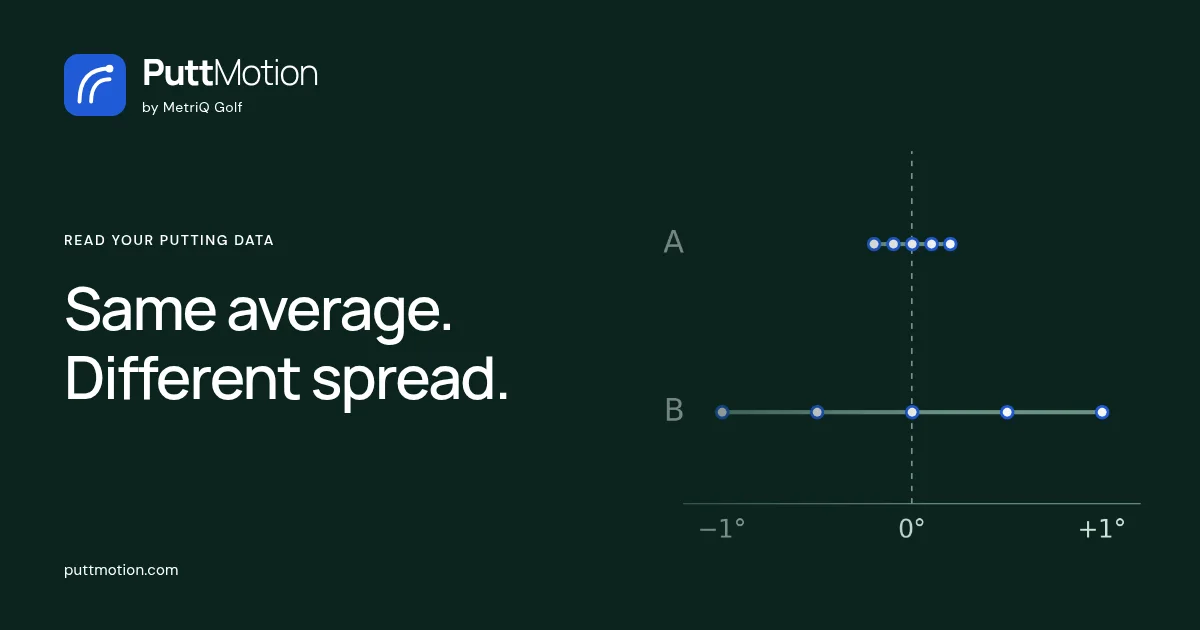
A zero-degree average can describe a tight group of face angles or larger errors that cancel out. Inspect individual values, spread and measurement conditions before changing technique. Then compare that session evidence with actual putting opportunities; neither the average nor the spread alone explains a missed putt.
An average putter-face angle at impact of zero degrees can come from a tight group of strokes or from larger deviations that cancel each other out. Before changing your putting technique, look at the individual values as well as the average.
This article uses a fictional external measurement report to explain that difference and help you choose a more useful practice question. You can review the example on paper, alongside an existing report and a coach’s assessment.
What a face average leaves out
In the SAM PuttLab 7 Reports Manual (February 2021), face angle at impact describes the putter face relative to the calibrated target line. Its report distinguishes the average from the spread of the individual values. Those answer different questions: where was the center of the group, and how much did the strokes vary around it?
Consider two entirely fictional session records. Each contains five strokes on a straight 6 ft putt, using the same putter and the same calibrated reference line. Negative and positive angles sit on opposite sides of zero under the same sign convention. These small sets illustrate the arithmetic; they are not a recommended test size or a validated putting protocol.
| Measurement | Record A | Record B |
|---|---|---|
| Individual face angles | −0.2°, −0.1°, 0°, +0.1°, +0.2° | −1.0°, −0.5°, 0°, +0.5°, +1.0° |
| Mean face angle | 0° | 0° |
| Range from lowest to highest | 0.4° | 2.0° |
The values in each record sum to zero. Divide by five and both averages are zero degrees. Yet Record B spans two degrees, while Record A spans four tenths of a degree. B has five times the range, even though its average is the same. That does not make its putting performance five times worse. Range here means maximum minus minimum; it is not SAM’s consistency score, a standard deviation or a probability of holing the next putt.
That changes the next coaching question. With B, inspect the strokes that produced the spread and whether it persists under the same task before making an adjustment intended to move the average. With A, this particular set gives no reason to shift the mean face angle simply because the player has missed putts on the course. A different question needs evidence of its own.
Put the measurement beside your course record
Now give the measurement a reason to matter. Review make rates by distance, with the attempts and counts that produced them. The mix of distances changes how a round total reads. For a short-putt question, examine the short putts themselves rather than starting with total putts per round.
Suppose a fictional player holed 12 of 20 recorded putts starting from 5–7 ft during four completed 18-hole stroke-play rounds over four weeks. All recorded attempts in that band are included, whether they were the first putt or a later putt on the hole. There were no conceded putts in these rounds. The observed conversion is 60%, with eight misses. The distances within that band and the green conditions were not identical.
Those eight misses give you specific putts to discuss with a coach. They do not show that face angle caused them, and 60% is not a future success probability. Consult your shot records and available notes. If you recorded starting and finishing positions, use them as context: a ball finishing beside the hole does not reveal the intended start line, your read or the quality of the stroke.
The 6 ft session task is relevant to the distance question, but it is not the same task as every 5–7 ft putt on a course. Slopes, pace, intended line and conditions can differ. If the record lacks those details, keep them as unknowns and observe them in the next session rather than filling them in from the outcome.
Let the two records lead to different checks
If the player’s measured session resembles Record B, start by reviewing the per-stroke face values and the session’s setup and calibration. Then repeat a clearly defined task and observe whether the variation remains. The practical decision is to investigate where the face variation is entering the stroke before trying to “correct” an average that is already centered. That is a measurement-led check, not proof that the recorded course misses came from face variation.
If the session resembles Record A, an adjustment that simply shifts the average would need another justification. A coach can instead observe the chosen line, aim, pace, strike and initial ball direction on representative putts, and compare those observations with the shot record. For example, a putt can start on the line the player intended and still miss because that line and pace do not fit the slope. The session’s face average cannot settle that question.
In both cases, write down what the next observation is meant to distinguish. For B: does the face variation recur when the task and reference line are held steady? For A: how do the player’s chosen line, pace and observed ball response fit a breaking putt? These are different investigations even though the two averages are identical.
Turn the comparison into a clear practice question
If you have an external putting report, keep its date, calibration reference and session conditions with it. Consult the original report for individual values rather than relying on a single summary number. That preserves the context needed to interpret a technical measurement.
For your next practice, write down the distance band and the actual attempts that prompted the question. Choose one observation that will help distinguish direction, pace or read, with a coach when useful. If a later session looks tighter, treat that as a session result and examine subsequent course opportunities separately. Neither a better average nor a tighter group alone establishes better scoring.
PuttMotion is available on the App Store, with putting drills, camera analysis, green reading and round statistics. You can use paper and an existing external report for this exercise. Begin with the putting opportunities, inspect the evidence and decide whether the next question concerns the center of a group, its variation or something the measurement cannot answer.
Sources and references
- Science & Motion — SAM PuttLab 7 Reports Manual, February 2021, pp. 28–29, 37 and 62 (external measurement definitions) ↗
- Take PuttMotion to the green ↗